

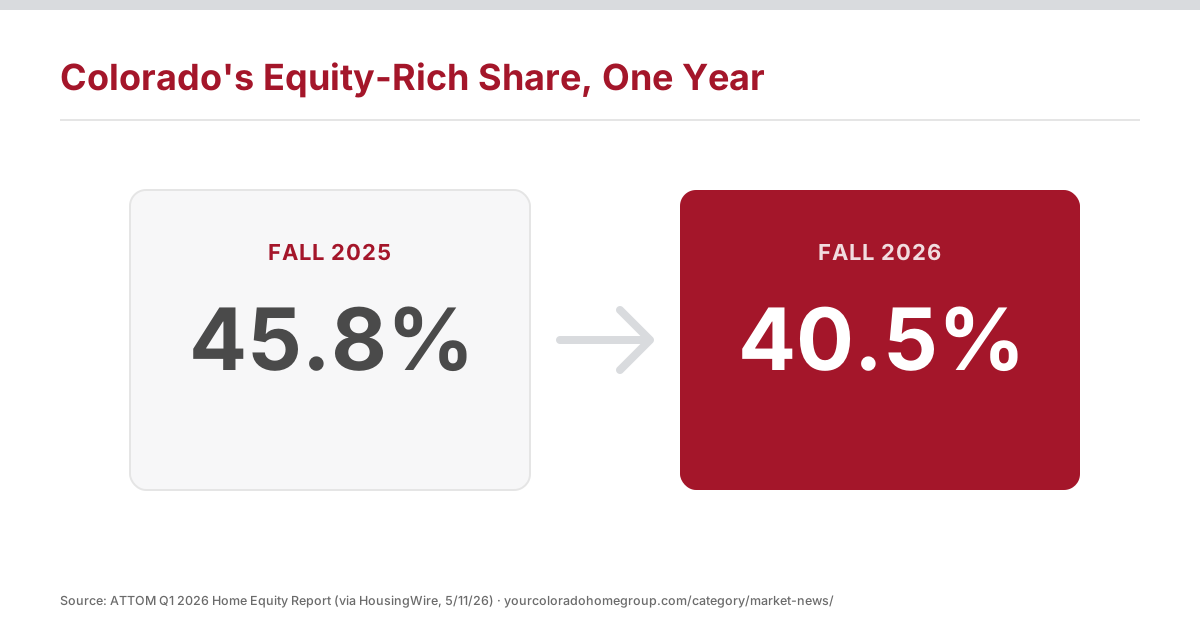
Colorado homeowners are sitting on less home equity than they were a year ago, and the drop here has been steeper than in almost any other state. According to ATTOM’s Q1 2026 U.S. Home Equity & Underwater Report, the share of Colorado mortgaged homes considered “equity-rich” — meaning the loan balance is 50% or less of the home’s estimated value — fell from 45.8% to 40.5% over the past year, one of the five largest declines nationwide. The national trend has kept moving the same direction since: ATTOM’s Q2 2026 report put the equity-rich share at 41.1% nationally, down from 43.3% the quarter before and 47.4% a year earlier — the fourth straight quarterly decline and the lowest level in almost five years.
That’s a meaningful shift, but it’s not a warning sign. Seriously underwater homes — where the mortgage balance is at least 25% above the home’s estimated value — are still uncommon in Colorado, and most owners who bought before 2021 are sitting on substantial gains even after this pullback. What’s actually changed is the size of the cushion. A couple of years of flatter or falling prices, layered on top of a wave of purchases made near the 2021–2022 peak, have narrowed the gap between what a lot of owners owe and what their home is worth today.
Why the thinner cushion matters at the negotiating table
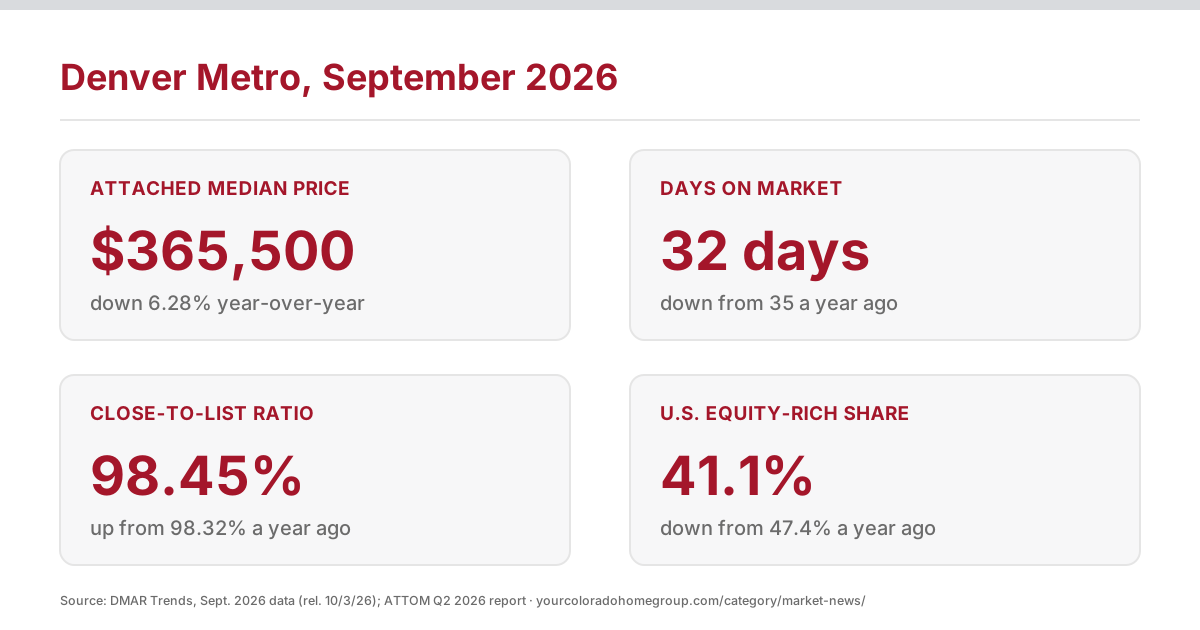
That narrower margin shows up directly in how deals get negotiated, not just in a report. Denver Metro Association of Realtors (DMAR) data for September 2026 shows attached-home prices down 6.28% year-over-year to a $365,500 median, and the report’s own commentary notes that seller-paid concessions and rate buydowns are increasingly standard parts of the negotiation rather than the exception they used to be. When your equity cushion is thinner, a concession that used to be a rounding error on the closing statement can take a real bite out of what you actually walk away with.
There’s a useful counterpoint in the same report, though: homes priced accurately are still moving well. September’s close-to-list price ratio was 98.45%, slightly better than a year earlier, and median days on market actually dropped to 32 days from 35. The homes losing the most ground right now tend to be the ones that get listed too high and then chased down with price cuts — not the ones priced correctly from day one. A thinner equity cushion makes that gap between “priced right” and “priced hopefully” more expensive than it used to be.
Where this week’s rate move fits in
Freddie Mac’s October 22 release put the 30-year fixed average at 7.32%, down from 7.40% the week before — a small move, not a trend-changer. Rates aren’t the reason equity has thinned out; price growth simply slowed from the pace that built most of that equity in the first place, back when homes were appreciating double digits a year. But every tenth of a point does shift how much buyer demand shows up at a given price point, which is part of why getting the number right matters more now than it did a few years ago, when almost any listing price still worked.
What this means for you
If you’ve been assuming your equity position looks the way it did a year or two ago, it’s worth checking the real number before you set a list price, not after. We pull an actual net sheet — what you’d walk away with at a few different price points, including realistic concessions and payoff figures, not just a guess off a home-value estimator — before we ever talk about where to list. If you bought between 2012 and 2017 and never refinanced, your cushion is often still wide even with this pullback. If you bought in 2021 or 2022, it’s worth knowing exactly where you stand before you list, not after an offer comes in lower than expected.
If selling isn’t on your radar right now, none of this calls for action — it’s market context, not a signal to do something differently. But if a move is on the table sometime in the next year, understanding your actual number now beats finding it out at the closing table.
Thinking about buying or selling? Let’s talk through what it actually means for your plan.
This is general market information, not financial, investment, or lending advice, and rates change daily — talk to your lender for a quote specific to you.
Sources
- ATTOM, Q1 2026 U.S. Home Equity & Underwater Report, as reported by HousingWire, May 11, 2026
- ATTOM, Q2 2026 U.S. Home Equity & Underwater Report, attomdata.com
- Denver Metro Association of Realtors (DMAR), Real Estate Market Trends Report, September 2026 data, released October 3, 2026
- Freddie Mac, Primary Mortgage Market Survey (PMMS), October 22, 2026
Leave a Reply