
November 2026 market update
The fewest October closings since 2010, and a concession on two out of every three sales
Closings fell again in October while prices held their ground. The real negotiation moved off the sticker price and onto the terms, and that changes what buyers and sellers should each be asking for.
Published November 4, 2026, updated November 12, 2026 with Boulder, Larimer, Weld and El Paso county data · October 2026 data · every figure checked against the source report
Greater Denver Metro
Closings hit a sixteen-year October low while prices held
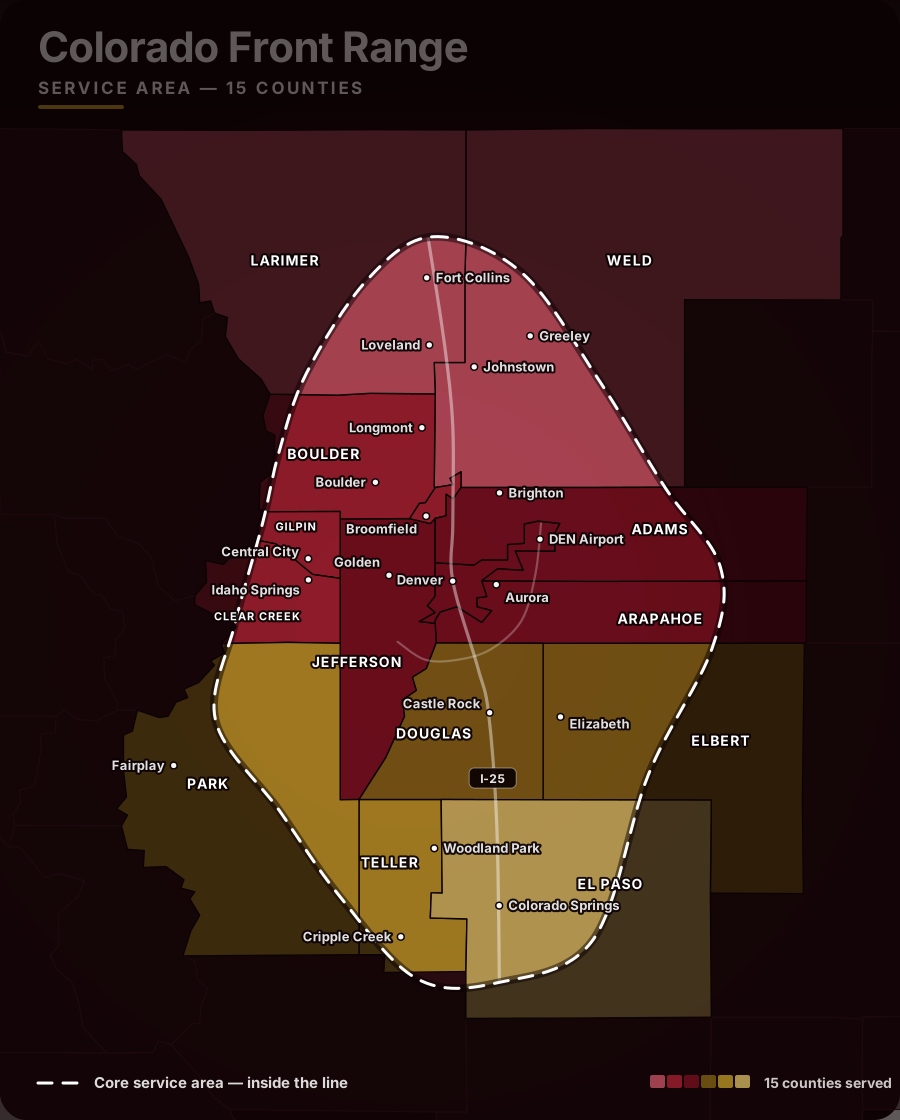
Adams, Arapahoe, Boulder, Broomfield, Clear Creek, Denver, Douglas, Elbert, Gilpin, Jefferson and Park counties. Source: the DMAR Market Trends Report for October 2026, from REcolorado data.
Closed sales
2,748
All property types. The fewest October closings since 2010.
Active listings
about 13,000
DMAR reports inventory hovering around this level, slightly below September.
Close price to list
98.36%
All property types, October closings.
Detached median
$645,000
Median close price, detached homes.
Attached median
$375,000
Condos and townhomes, median close price.
Seller concessions
65%
Share of October closings that included a seller concession, averaging $12,557.
2,748 homes closed across the metro in October, down 8.58% from September and 23.54% from last October. That is the fewest October closings since 2010, and it follows September’s move up in mortgage rates. Pending sales fell both month over month and year over year. New listings were down 16.70% from September and 9.02% from a year ago, so sellers are stepping back about as fast as buyers are.
Inventory is the part that favours buyers: still about 13,000 listings, 3.87% above last October. Detached homes closed at a median of $645,000, up 1.57% from September and only 0.64% below last October, at 98.55% of list in a median of 26 days. Condos and townhomes are a different market: a median of $375,000, 97.69% of list, 48 days to sell and more than seven months of supply.
DetachedAttached
Source: DMAR October 2026 report. The detached year-to-date median matches both 2025 and 2024; the attached year-to-date median is down 3.16 percent from 2025.
View the data
| Measure | Detached | Attached |
|---|---|---|
| October 2026 median | $645,000 | $375,000 |
| 2026 year-to-date median | $650,000 | $382,500 |
| Change vs September | up 1.57% | up 2.74% |
| Change vs last October | down 0.64% | down 3.25% |
Source: DMAR October 2026 report. Detached homes sold four days faster than last October; attached homes took 17.07% longer.
View the data
| Property type | Median days in the MLS | Change vs last October |
|---|---|---|
| Detached | 26 | four days faster |
| Attached | 48 | up 17.07% |
Source: DMAR October 2026 report, which published the 65 percent share and an average concession of $12,557. The 35 percent is the remainder of that reported share.
View the data
| October 2026 closings | Share |
|---|---|
| Included a seller concession | 65% |
| Did not | 35% |
| Average concession | $12,557 |
“Sellers fear leaving money on the table, while buyers worry about overpaying or missing a better deal. Fear thrives where information is scarce, but market data, strategic pricing and clear, professional communication can replace uncertainty with confidence.”
Amanda Snitker, Chair of the DMAR Market Trends Committee
The million-dollar-plus segment
Properties sold at $1 million and above.
Year to date this segment looks steady: 4,878 closings against 4,890 last year, volume edging up to $8.0 billion, a median 16 days on market, 98.27% of list and $381 per square foot, up 0.53% from 2025. The month on its own tells a sharper story: closings down 24.05% year over year and volume down 26.04% to $656 million. Detached homes are carrying the segment, while attached luxury softens, with price per square foot down 9.72% year over year.
Source: DMAR October 2026 report. Faster, but on fewer deals: closings in this segment fell 24.05% year over year and volume fell 26.04% to $656 million.
View the data
| Period | Median days on market |
|---|---|
| October 2025 | 34 |
| October 2026 | 17 |
October’s highest-priced detached sale was 6917 Timbers Drive in Evergreen at $7,224,000. The highest attached sale was 250 Columbine Street #701 at $10,250,000.
The year-to-date detached median close price of $650,000 is unchanged from both 2025 and 2024. The attached year-to-date median of $382,500 is down 3.16 percent from 2025. Concessions are part of why prices look so stable: a seller credit that covers closing costs or buys down a rate can be worth more to a buyer than the same money off the price, and it still records as a higher sale price.
Colorado Springs and El Paso County
The steadiest market on this page, with the condo side softening
Source: the Colorado Association of REALTORS Local Market Update for October 2026, current as of November 4, 2026, retrieved November 12, 2026. Figures cross-checked against the CAR sortable statistics tables.
Median close price
$479,000
Single family, October closings.
Closed sales
681
Single family homes closed in October.
New listings
1,012
Single family homes newly listed in October.
Homes for sale
3,564
Single family inventory at month end.
Months of supply
4.3
Single family. Six months is the usual balance point.
Percent of list
98.6%
Single family, share of list price received.
El Paso County held up better than anywhere else covered here. Single family closings fell 9.3% to 681, the mildest drop on this page, and the median rose 0.8% to $479,000. The average sale price rose faster, up 4.4% to $551,661, which usually means the upper end of the market is doing more of the work. Sellers received 98.6% of list. Inventory is essentially flat against last year at 3,564 homes and 4.3 months of supply, so this is still a tight detached market by any historical measure.
The attached market is the part to watch. Closings fell 19.4% to 104 while new listings rose 1.7%, and months of supply climbed from 5.3 to 5.9 as inventory reached 691 units. That is close to the six-month mark where negotiating power normally shifts to buyers. Oddly, condos are also selling faster than a year ago, down 13.4% to 58 days, and the median rose 4.7% to $335,000. More supply and quicker sales at the same time usually means the well-priced units are moving and the rest are sitting.
Single familyTownhouse and condo
Source: Colorado Association of REALTORS Local Market Update for October 2026. Single family days on market rose 9.8% while townhouse and condo days fell 13.4%.
View the data
| Property type | October 2025 | October 2026 | Change |
|---|---|---|---|
| Single family | 51 days | 56 days | up 9.8% |
| Townhouse and condo | 67 days | 58 days | down 13.4% |
Single familyTownhouse and condo
Source: Colorado Association of REALTORS Local Market Update for October 2026. Six months of supply is the conventional dividing line between a seller market and a buyer market.
View the data
| Property type | October 2025 | October 2026 | Change |
|---|---|---|---|
| Single family | 4.2 | 4.3 | up 2.4% |
| Townhouse and condo | 5.3 | 5.9 | up 11.3% |
A note on the source: El Paso County figures now come from the Colorado Association of REALTORS rather than from the Pikes Peak Association of REALTORS, which we used through September 2026. The two count the market differently and the CAR counts run roughly twenty percent below the PPAR counts, so figures either side of that change are not comparable and should not be read as one continuous series. Everything in this section is CAR data throughout, so the year-over-year comparisons inside it are like for like.
Boulder, Larimer and Weld counties
Closings down sharply, prices barely moved, and Weld is the outlier
Source: the Colorado Association of REALTORS Local Market Update for October 2026, current as of November 4, 2026, retrieved November 12, 2026. Figures cross-checked against the CAR sortable statistics tables.
Boulder County median
$835,000
Single family, October close price.
Larimer County median
$593,150
Single family, October close price.
Weld County median
$495,000
Single family, October close price.
Boulder percent of list
97.8%
Single family, share of list price received.
Larimer percent of list
98.1%
Single family, share of list price received.
Weld percent of list
99.0%
Single family, share of list price received.
All three counties saw single family closings drop hard against last October: Boulder down 27.3% to 210, Larimer down 27.7% to 276, Weld down 21.1% to 306. Prices did not follow. Boulder’s median rose 1.2% to $835,000 and Larimer’s rose 0.5% to $593,150. Weld is the only one of the three where the median fell, down 3.0% to $495,000, and it is also the only one where homes are taking longer to sell than a year ago, up 9.5% to 81 days.
Sellers are holding the line on price. Weld single family homes closed at 99.0% of list, Larimer at 98.1% and Boulder at 97.8%. Inventory went in different directions: Boulder fell 12.0% to 876 detached homes for sale and Weld fell 3.3% to 1,482, while Larimer is the one county with more on the market than a year ago, up 4.2% to 1,413. Supply is tight by historical standards on the detached side, at 3.6 months in Boulder and 3.8 months in both Larimer and Weld, but the attached market is looser everywhere: 5.2 months in Boulder, 4.3 in Larimer and 4.7 in Weld. Weld’s small attached market is the one place a median jumped, up 12.3% to $364,995 on just 26 closings, which is the kind of swing a thin sample produces.
Single familyTownhouse and condo
Source: Colorado Association of REALTORS Local Market Update for October 2026, current as of November 4, 2026.
View the data
| County | Single family median | Change | Townhouse and condo median | Change |
|---|---|---|---|---|
| Boulder | $835,000 | up 1.2% | $533,750 | down 1.2% |
| Larimer | $593,150 | up 0.5% | $414,995 | down 1.2% |
| Weld | $495,000 | down 3.0% | $364,995 | up 12.3% |
Single familyTownhouse and condo
Source: Colorado Association of REALTORS Local Market Update for October 2026. Single family closings fell 27.3% in Boulder, 27.7% in Larimer and 21.1% in Weld against last October.
View the data
| County | Single family closed | Change | New listings, single family | Single family homes for sale | Townhouse and condo closed | Townhouse and condo homes for sale |
|---|---|---|---|---|---|---|
| Boulder | 210 | down 27.3% | 287 | 876 | 70 | 378 |
| Larimer | 276 | down 27.7% | 461 | 1,413 | 68 | 350 |
| Weld | 306 | down 21.1% | 478 | 1,482 | 26 | 168 |
Single familyTownhouse and condo
Source: Colorado Association of REALTORS Local Market Update for October 2026. Weld is the one county where single family homes are taking longer than a year ago, up 9.5%.
View the data
| County | Single family days | Change | Townhouse and condo days | Months supply, single family |
|---|---|---|---|---|
| Boulder | 65 | down 3.0% | 76 | 3.6 |
| Larimer | 77 | down 3.8% | 89 | 3.8 |
| Weld | 81 | up 9.5% | 76 | 3.8 |
Two things worth knowing about these figures. First, the Colorado Association of REALTORS restates the prior-year baseline in each new report as late-reported sales are added, so last October as it appears in this report will not match last October as it was first published. We use each report’s own baseline rather than stitching vintages together, which is why the percentage changes here are the ones CAR publishes. Second, Boulder County also sits inside the eleven-county Greater Denver Metro area covered higher up this page, so it is counted in both places: once as part of the DMAR metro totals from REcolorado data, and once here as a standalone county from CAR. The two are different publishers measuring different areas, not a contradiction.
What it means
Where the leverage actually sits this month
If you are buying
- There are still about 13,000 active listings, 3.87% more than last October, and competition thins out through the holidays.
- Condos and townhomes are where the room is: more than seven months of supply at a $375,000 median and 97.69% of list.
- Negotiate the terms, not just the price. 65 percent of October closings included a seller concession, averaging $12,557.
- A credit toward closing costs or a rate buydown can beat the same dollars off the price, and it is the reason headline prices look so steady.
- Outside the metro, El Paso County condos now carry 5.9 months of supply and Boulder County condos 5.2, both close to or past the six-month line where buyers normally gain the upper hand.
If you are selling
- Detached homes still closed at 98.55% of list in a median of 26 days, four days faster than last October. Priced to today, they move.
- Attached homes took 48 days and 97.69% of list. Plan for a longer runway and price accordingly.
- Build the concession into the strategy up front instead of conceding it after three weeks of silence.
- Above $1 million, closings fell 24.05% year over year even as median days on market halved to 17. Fewer buyers, and the ones who are there move quickly.
- North of the metro, sellers are still getting 97.8% to 99.0% of list on detached homes, but it is taking 65 to 81 days. Price for a two-month runway rather than a two-week one.
Want to know what this means for your address?
Metro-wide numbers set the backdrop. What your home is worth, or what you can buy, comes down to your street, your price band and your timing. Grab a slot and we will walk through it.
Sources and method
Where these numbers come from
- Greater Denver Metro: DMAR Real Estate Market Trends Report, October 2026, published November 4, 2026. Statistics sourced from REcolorado.
- Boulder, Larimer, Weld and El Paso counties: Colorado Association of REALTORS Local Market Update for October 2026, current as of November 4, 2026, retrieved November 12, 2026. County reports: Boulder, Larimer, Weld and El Paso. Every shared figure was cross-checked against the CAR sortable statistics tables for single family and townhouse and condo: 32 of 32 matched, and all 112 reported percentage changes reconciled against the reports’ own figures. See CAR market trends.
Every figure on this page is checked against the published report before it goes up. Where a region’s data is not out yet we say so and name the date rather than printing an estimate, and we do not build back-series by working backwards from percentage changes.
One thing to know about the month-over-month percentages above: they are DMAR’s own, and DMAR revises the prior month in each new report as late closings record. They therefore will not reconcile exactly against the September figures published on last month’s page, which stay as they were first reported. Older pages are never retrofitted.
DMAR did not publish an exact active-listing count, a new-listings count, a pending-sales count, an overall median close price or a detached months-of-supply figure for October, so none of those appears here as a figure. Inventory is given as the report gives it, and the direction of pending sales and new listings is reported without a count.
Mike Rush and Bill Leeper · Your Colorado Home Group · Keller Williams Realty DTC · 719-440-8249