
Colorado Housing Market Update: August 2026 Data
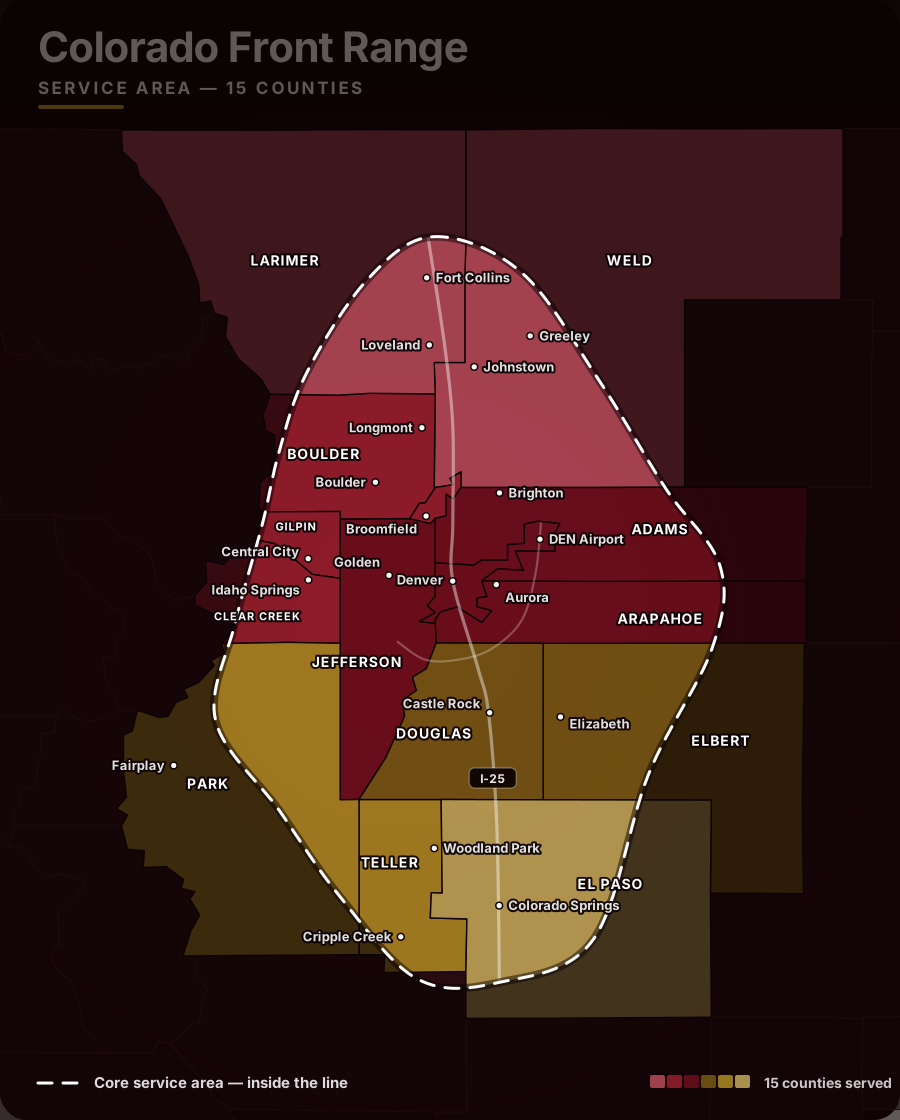
August was a month of three signals pointing three different directions. Inventory held flat, prices barely moved, and closed sales fell hard. Here is what actually happened across the Front Range, county by county, with every number traced back to its source report.
Denver Metro, August 2026
Adams, Arapahoe, Boulder, Broomfield, Clear Creek, Denver, Douglas, Elbert, Gilpin, Jefferson and Park counties.
Active listings ended August at 13,080, essentially flat month over month and year over year, which suggests the steady inventory growth tracked through the first half of 2026 may be leveling off. Closed sales fell 18.99 percent from July and 17.35 percent from last August, and sales volume dropped 19.45 percent month over month.
Yet the median close price of $594,495 is essentially unchanged from a year ago and down only 1.74 percent from July. Homes are taking longer to sell, with median days in MLS rising to 27 from 21 in July, though still faster than last August’s 30. Fewer transactions, slightly less pricing pressure, and no sign of decline in the price data itself.
Year-to-date closings are down 3.49 percent from 2025, and the year-to-date median price of $599,990 is up a mere 0.17 percent.
View the numbers as a table
| Period | Median days in MLS |
|---|---|
| Aug 2025 | 30 |
| Jul 2026 | 21 |
| Aug 2026 | 27 |
Detached and attached are two different markets
The single-family and condo/townhome markets moved in opposite directions in August. A client selling a condo is not facing the conditions a single-family seller faces. Detached median prices held essentially flat year over year. Attached prices fell 4.87 percent.
View the numbers as a table
| Property type | Inventory change year over year |
|---|---|
| Detached | -4.21% |
| Attached | +9.94% |
View the numbers as a table
| Property type | Median days in MLS |
|---|---|
| Detached | 24 |
| Attached | 45 |
The $1 million-plus market
- Of the 668 new listings above $1 million, 628 were single-family detached homes.
- Detached properties accounted for 95.6 percent of all $1 million-plus closings.
- Combined average days in MLS rose 28.95 percent from July.
- Highest detached sale4030 E. Forbes Court, Littleton — $7,388,943, 1 day in MLS
- Highest attached sale1133 14th Street #4050, Four Seasons Residences, Denver — $3,800,000, cash
View the numbers as a table
| Period | Detached luxury | Attached luxury |
|---|---|---|
| Aug 2025 | 51 | 50 |
| Aug 2026 | 47 | 99 |
Source: DMAR Market Trends Report, published September 3, 2026. Statistics sourced from REcolorado.
Colorado Springs and El Paso County, August 2026
El Paso and Teller county residential activity reported through elevate MLS.
Colorado Springs told a quieter version of the same story. Single-family closings fell 12.3 percent from July to 996, new listings dropped 15.7 percent, and the median sales price eased to $470,000, down 5.0 percent month over month and 2.1 percent year over year.
Inventory is the number worth watching. Active single-family listings ended August at 4,297, up 3.8 percent from a year ago and nearly 52 percent above the December 2025 trough of 2,831. Months supply rose to 4.3 from 3.8 in July.
The condo and townhome market is looser still, at 5.8 months of supply against 4.2 a year ago, with active listings up 11.4 percent year over year and closings down 19.5 percent.
View the numbers as a table
| Month | Active listings |
|---|---|
| Aug 25 | 4,139 |
| Sep 25 | 4,006 |
| Oct 25 | 3,915 |
| Nov 25 | 3,552 |
| Dec 25 | 2,831 |
| Jan 26 | 2,837 |
| Feb 26 | 2,919 |
| Mar 26 | 3,051 |
| Apr 26 | 3,416 |
| May 26 | 3,665 |
| Jun 26 | 4,035 |
| Jul 26 | 4,312 |
| Aug 26 | 4,292 |
View the numbers as a table
| Month | Average sales price | Median sales price |
|---|---|---|
| Aug 25 | $566,443 | $480,000 |
| Sep 25 | $565,356 | $479,450 |
| Oct 25 | $543,590 | $473,500 |
| Nov 25 | $551,605 | $491,990 |
| Dec 25 | $531,469 | $460,000 |
| Jan 26 | $543,847 | $469,950 |
| Feb 26 | $524,494 | $465,000 |
| Mar 26 | $539,720 | $475,000 |
| Apr 26 | $558,220 | $480,000 |
| May 26 | $577,202 | $499,962 |
| Jun 26 | $577,638 | $499,900 |
| Jul 26 | $568,633 | $494,950 |
| Aug 26 | $547,521 | $470,000 |
View the numbers as a table
| Month | Average days on market |
|---|---|
| Aug 25 | 43 |
| Sep 25 | 54 |
| Oct 25 | 54 |
| Nov 25 | 57 |
| Dec 25 | 65 |
| Jan 26 | 74 |
| Feb 26 | 67 |
| Mar 26 | 61 |
| Apr 26 | 54 |
| May 26 | 43 |
| Jun 26 | 45 |
| Jul 26 | 48 |
| Aug 26 | 49 |
Condo and townhome market
Year to date, January through August
| Measure | 2026 | 2025 | Change |
|---|---|---|---|
| Single family, closed sales | 8,180 | 8,142 | +0.5% |
| Single family, average price | $557,535 | $564,188 | -1.2% |
| Single family, sales volume | $4.56B | $4.59B | -0.7% |
| Condo/townhome, closed sales | 1,011 | 1,097 | -7.8% |
| Condo/townhome, average price | $340,659 | $361,673 | -5.8% |
| Condo/townhome, sales volume | $344.4M | $396.8M | -13.2% |
Boulder, Larimer and Weld counties, August 2026
County-level residential activity reported through the Colorado Association of REALTORS, drawn from the multiple listing services in the state of Colorado.
All three northern counties tell the same story in a different accent: fewer sales, slightly softer prices, and less inventory than a year ago. Single-family closings fell 20.1 percent from last August in Boulder, 16.5 percent in Weld and 10.7 percent in Larimer. Median single-family prices slipped in all three, but modestly, to $809,950 in Boulder (down 3.0 percent), $601,695 in Larimer (down 1.2 percent) and $499,900 in Weld (down 2.0 percent).
What is not loosening is supply. Inventory of homes for sale is down year over year in every county, by 21.4 percent in Boulder, 10.7 percent in Larimer and 9.3 percent in Weld. Sellers are also still getting close to their asking price: 98.6 percent of list in Boulder, 98.8 percent in Larimer and 99.2 percent in Weld.
View the numbers as a table
| County | Single family | Townhouse / condo |
|---|---|---|
| Boulder | $809,950 | $417,500 |
| Larimer | $601,695 | $399,800 |
| Weld | $499,900 | $344,900 |
Single family is tight, attached is not
The detached and attached split that runs through Denver shows up here just as clearly. Single-family months supply sits between 3.3 and 3.5 across the three counties, which is still a seller-leaning market. Condo and townhome supply runs 4.4 to 5.3 months. Boulder is the sharpest example on this page: its attached median fell 12.6 percent year over year to $417,500, on 58 closings against 86 a year ago.
View the numbers as a table
| County | Single family | Townhouse / condo |
|---|---|---|
| Boulder | 3.3 | 5.3 |
| Larimer | 3.5 | 4.4 |
| Weld | 3.4 | 4.8 |
August at a glance, all three counties
| County | Type | Closed sales | Median price | Days on market | Months supply | Percent of list |
|---|---|---|---|---|---|---|
| Boulder | Single family | 231 | $809,950 | 58 | 3.3 | 98.6% |
| Boulder | Townhouse / condo | 58 | $417,500 | 82 | 5.3 | 97.3% |
| Larimer | Single family | 366 | $601,695 | 66 | 3.5 | 98.8% |
| Larimer | Townhouse / condo | 75 | $399,800 | 67 | 4.4 | 98.2% |
| Weld | Single family | 338 | $499,900 | 69 | 3.4 | 99.2% |
| Weld | Townhouse / condo | 37 | $344,900 | 82 | 4.8 | 98.4% |
What August actually means for you
If you are selling
- Pricing pressure is mild but real: Denver metro median close price is flat year over year, and homes are sitting a week longer than they were in July.
- Property type matters more than the headline number. Detached inventory is down 4.21 percent year over year while attached is up 9.94 percent, and attached homes are taking 45 median days against 24 for detached.
- In Colorado Springs, 4.3 months of single-family supply is the loosest August in the last two years. Condo sellers are looking at 5.8 months.
- North of Denver the single-family market is still tight: 3.3 to 3.5 months of supply across Boulder, Larimer and Weld, with sellers getting 98.6 to 99.2 percent of list price.
If you are buying
- Fewer buyers closed in August than in any recent month, which means less competition on the homes that are still sitting.
- Attached and condo inventory is the clearest opportunity in both markets, with the widest year-over-year inventory growth and the longest days on market.
- Colorado Springs single-family inventory is 52 percent above its December low, so buyer choice there is materially better than it was nine months ago.
- Condos and townhomes in the northern counties are the softest corner of the region: 4.4 to 5.3 months of supply, and Boulder attached medians are down 12.6 percent year over year.
Want to know what this means for your address?
Market averages are an average of many individual outcomes. Your neighborhood, your price band and your timeline can each move the answer. Book a free strategy call and we will look at your actual numbers together.
Book a free strategy callWhere these numbers come from
- Denver metro figures are from the DMAR Market Trends Report for August 2026, published September 3, 2026, sourced from REcolorado.
- Colorado Springs figures are from the PPAR / elevate MLS Listing and Sales Summary for August 2026, maintained by REALTOR Services Corp.
- Active listing counts are status-driven snapshots and can vary slightly depending on when the data is pulled. The PPAR trend chart shows 4,292 active single-family listings for August where the summary table reports 4,297, a difference of 0.1 percent.
- Beginning in 2026, PPAR no longer publishes percentage change calculations for months supply, so those are shown as raw values.
- Figures do not include for-sale-by-owner transactions or all new construction.
 Keller Williams Realty DTC